Skip to summary

From first stepto lasting habit.

I was part of the team that built Minha Corrida, a platform that turns every workout into points, challenges, community and rewards from local partners. From the product to the films, the goal was to keep people moving.

Read the case study

In 30 seconds.

Role
Product design on the Minha Corrida team
Timeline
Launched April 2026, live
Platform
Mobile web app, admin panel and Strava sync
Deliverables
Product and UX, motion, sales and data
Challenge
Running is easy to start and hard to keep up. The product had to turn early enthusiasm into consistency and create value for partners and companies.
My role
I was part of the product team: the app and admin experience, launch films and motion, sales materials and data analysis.
Solution
An app that reads Strava workouts, rewards consistency with points, matches challenges to each profile and level, and turns points into rewards from local partners.
Signals
In seven months: 878 runners, 63.4% weekly retention and 38,642 km logged in the last 30 days alone.

Starting is easy.
Staying is hard.

Training apps record what people have already done. They lacked a reason to come back tomorrow, someone to run with and a visible return on the effort.

A loop where everyone wins.

The model connects three sides. Every workout earns points, every point brings someone to a partner, and every partner funds new challenges.

  1. You move

    The workout arrives from Strava or the in-app timer and turns into MC.

  2. Your team moves up

    Community challenges and rankings give people a reason to train again.

  3. Partners gain customers

    Points become rewards at local businesses, which gain visits.

  4. Employers recognize effort

    With Vida Ativa, team activity becomes a wellbeing indicator.

Every run is a game.

Real app screens, captured on a phone. Navigation fits under the thumb: Home, Challenges, Communities, Rewards and More.

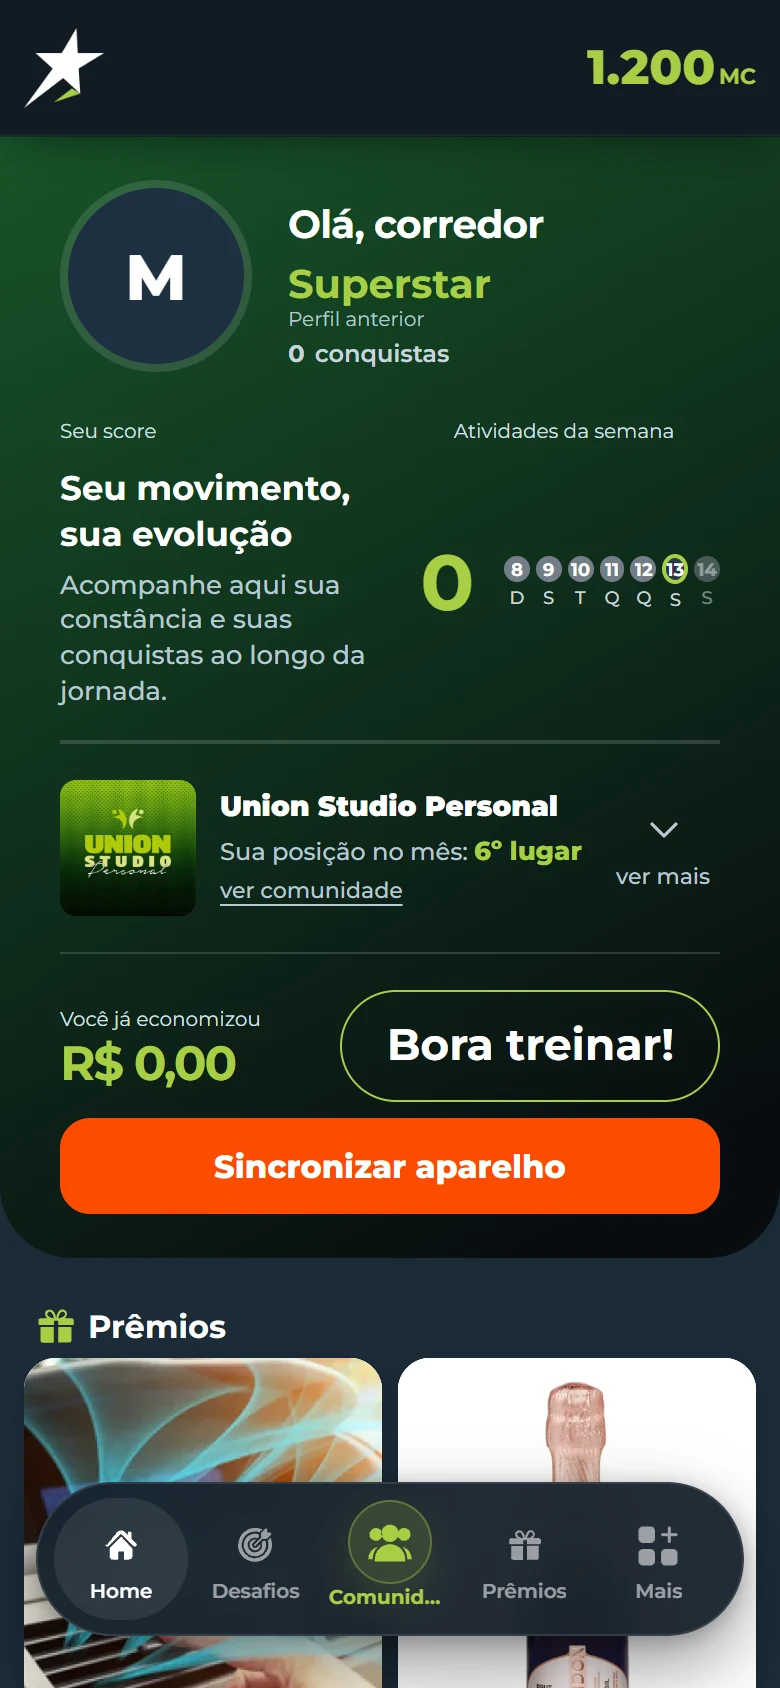
  1. Connect and start

    The home screen shows your score, this week’s workouts, your community ranking and what to do next. Strava syncs workouts without a paid subscription.

    Minha Corrida home screen with score, weekly activity and community
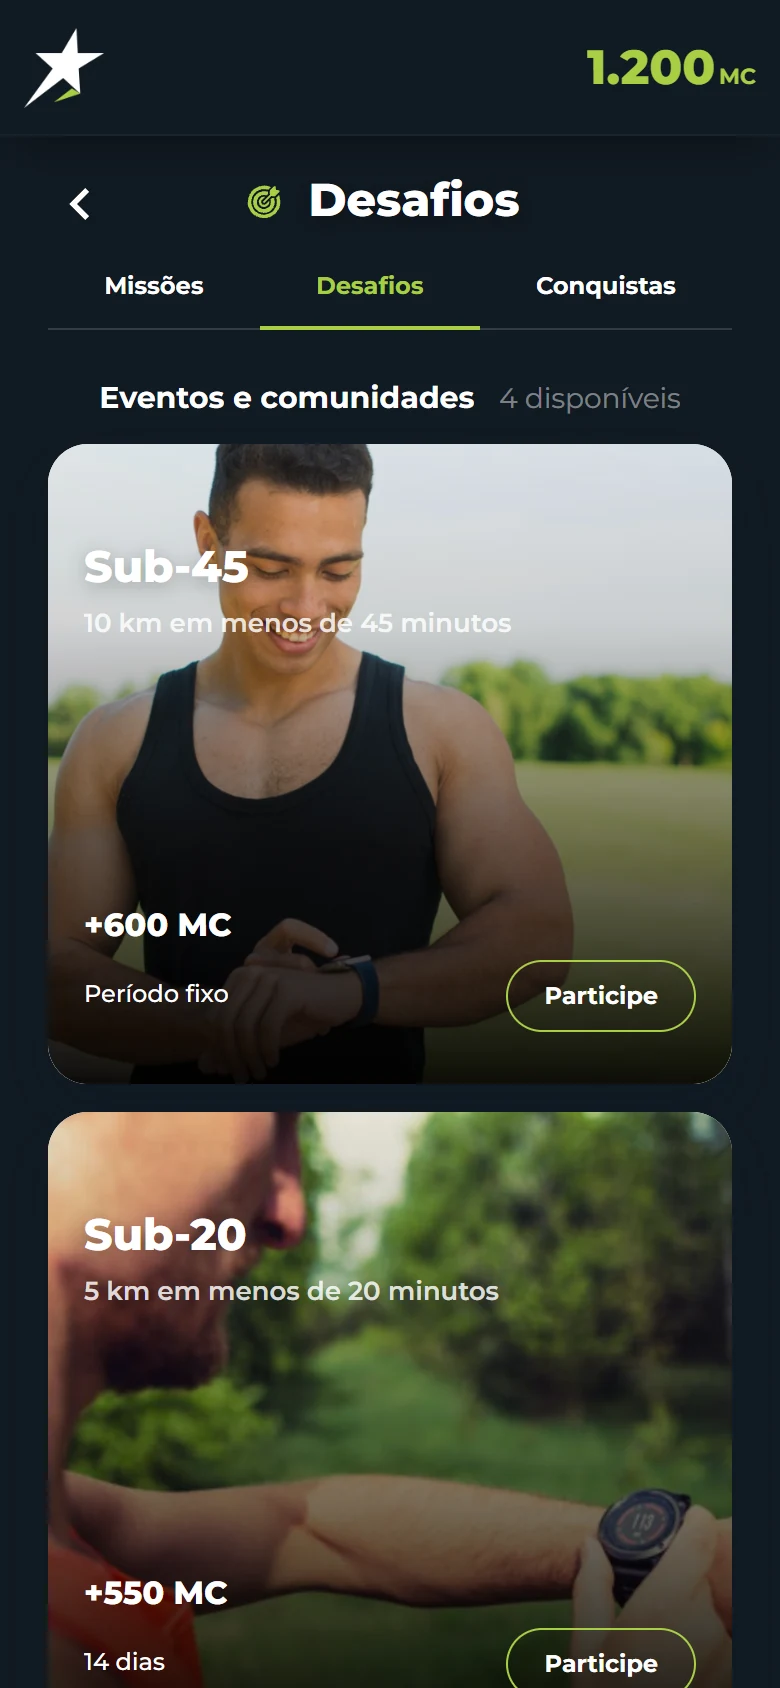
  2. Challenges with a clear goal

    Each challenge states the goal, the deadline and how many MC, the app currency, it pays.

    Challenge list with sub-45 and sub-20 goals
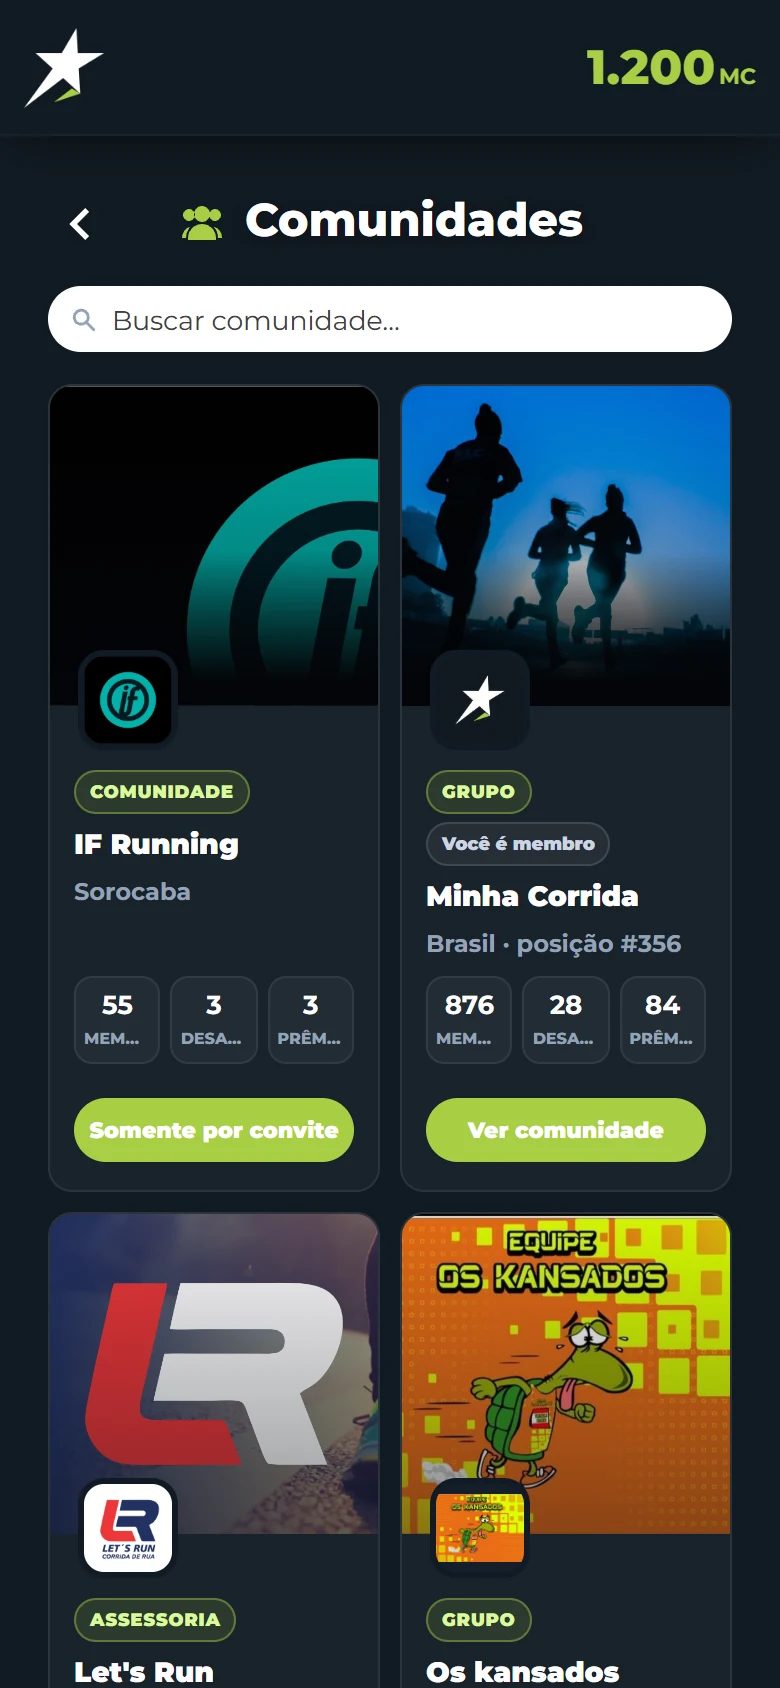
  3. Real communities

    Running clubs, coaches and companies get their own space, rankings and challenges. People run with people they already know.

    Community list with running clubs and groups
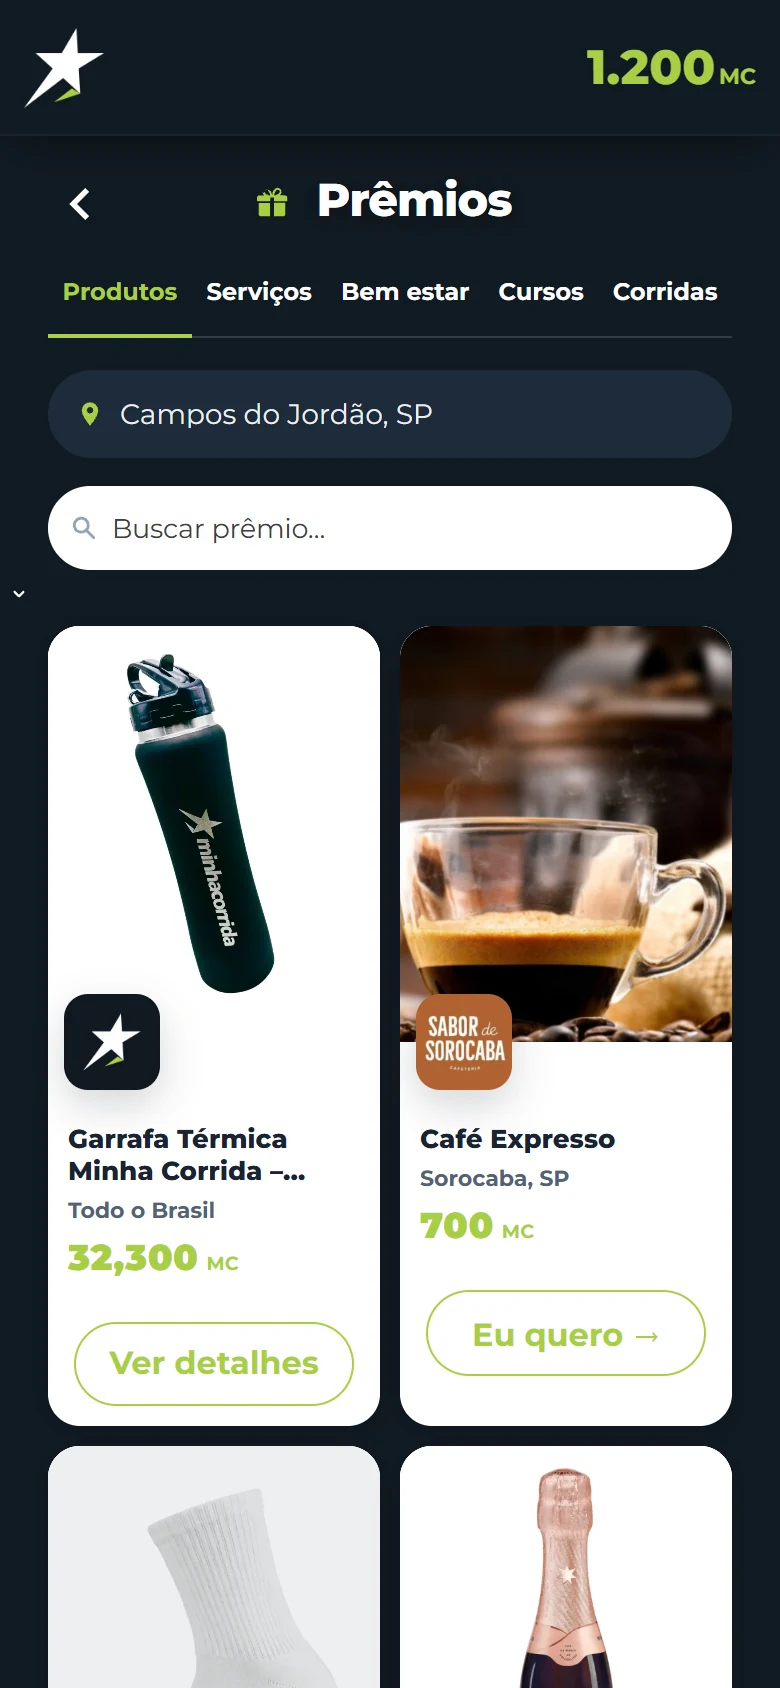
  4. Rewards around town

    Points become perks from local partners: coffee, burgers, socks, physiotherapy.

    Rewards catalog with a bottle and an espresso
  5. Progress by level

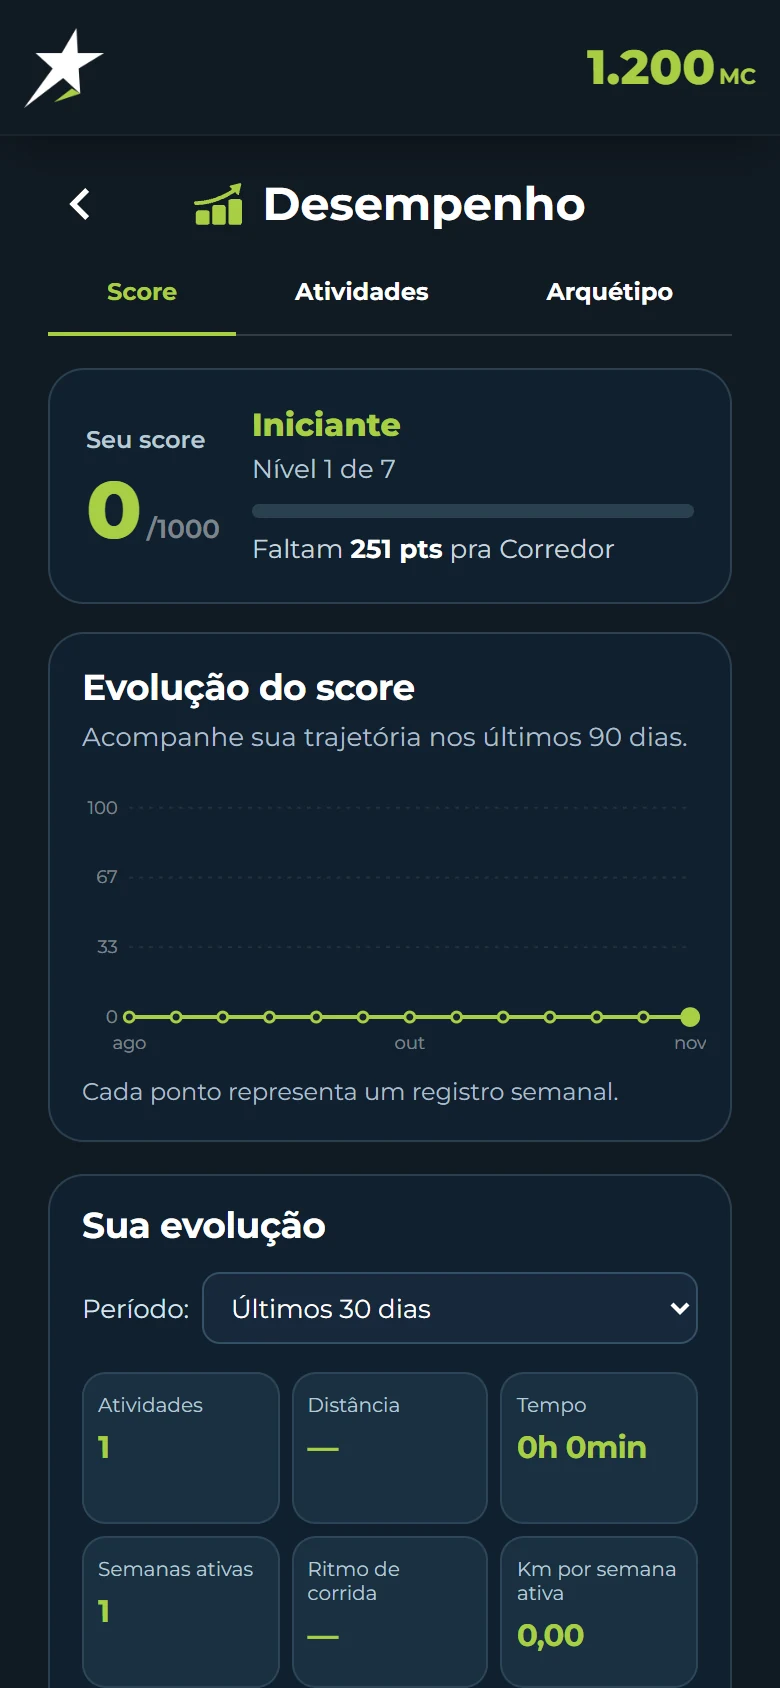
    A score from 0 to 1000 and seven levels, from Beginner to Legend, show how far the next step is.

    Performance screen with score and level
  6. A profile for every runner

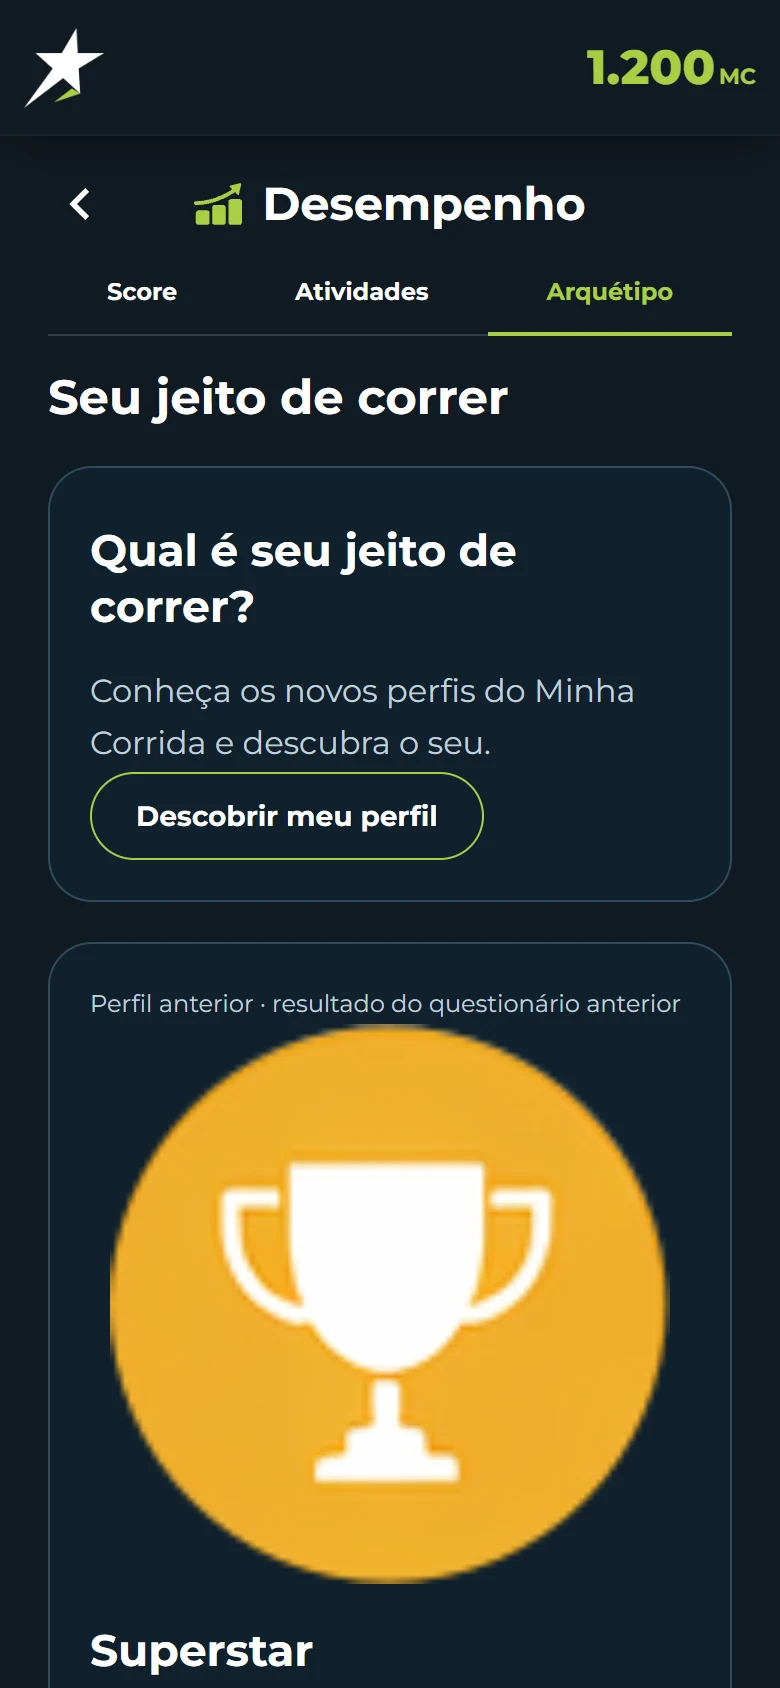
    A short quiz assigns an archetype, each person’s running style, and guides challenge selection.

    Archetype screen: your running style

A challenge for every pace.

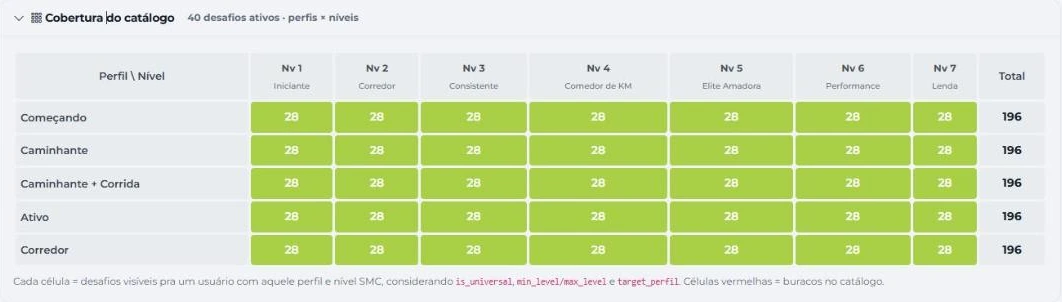
The app crosses each person’s profile with their level to show only reachable challenges. Right now, every combination sees 28 of the 40 active challenges: nobody is left without options.

5 profiles

How the person moves today, answered at sign-up.

  • Getting started
  • Walker
  • Walk + run
  • Active
  • Runner

7 levels

They rise with the score. Tap a level to see how many runners are there.

490 runners, 56% of the base, are at level 1. Moving that majority up to level 2 is the catalog’s biggest job.

9 challenge types

52 challenges in the catalog, built from these formats.

  • Single distance
  • Period total
  • Number of workouts
  • Day streak
  • Ranking
  • Location check-in
  • Performance
  • Lap workout
  • Custom

Seven months in numbers.

Data taken from the admin panel on November 13, 2026, read only. Aggregated counts, no personal data.

63.4%weekly retention+4.0 pts vs. the previous week
  • 409active users in 30 days+36.8% vs. the previous 30 days
  • 9.59sessions per user per month+15.8%
  • 64.5%return on two or more daysin the month

Sign-ups by month

Launched on April 16, with two growth waves: May, with 222 sign-ups, and September to October, with 392.

  • Growth waves
  • Other months
* November through the 13th
  1. Apr
  2. 222May
  3. Jun
  4. Jul
  5. Aug
  6. 154Sep
  7. 238Oct
  8. Nov*
View the data as a table
Sign-ups by month
MonthSign-ups
April28
May222
June44
July83
August28
September154
October238
November81

Who keeps training

For each sign-up month: how many people connected Strava and how many still worked out in the last 30 days. People who joined after May stay more.

  • Connected Strava
  • Worked out in the last 30 days
Who keeps training, by sign-up month April: 61% connected Strava, 43% worked out in the last 30 days; May: 47% connected Strava, 22% worked out in the last 30 days; June: 77% connected Strava, 61% worked out in the last 30 days; July: 76% connected Strava, 64% worked out in the last 30 days; August: 82% connected Strava, 64% worked out in the last 30 days; September: 77% connected Strava, 57% worked out in the last 30 days; October: 75% connected Strava, 58% worked out in the last 30 days; November: 69% connected Strava, 49% worked out in the last 30 days 0%25%50%75%100%AprMayJunJulAugSepOctNov Strava 69% Trained 49%
View the data as a table
Who keeps training, by sign-up month
Sign-up monthSign-upsStravaTrained in 30 days
April2861%43%
May22247%22%
June4477%61%
July8376%64%
August2882%64%
September15477%57%
October23875%58%
November8169%49%

Activation funnel

From sign-up to challenge. The biggest drop happens before people connect Strava.

  1. 878Sign-upseveryone since April
  2. 595Connected Strava67.8% of the base
  3. 424Trained in 30 days71.3% of those connected
  4. 232Joined challenges26.4% of the base, in 30 days

How consistently people train

Days with a workout in the last 30 days, among 424 active runners. 169 trained on 12 days or more. The median runner covered 72.6 km over 10 days.

  • 12 days or more
  • Fewer than 12 days
  1. 731–3
  2. 854–7
  3. 978–11
  4. 13812–19
  5. 3120+
View the data as a table
Runners by days with a workout in 30 days
Days with a workoutRunners
1–373
4–785
8–1197
12–19138
20+31

Concentrated referrals

497 invites, 277 became sign-ups (55.7%), from 37 people.

89%of invites came from just 9 people

Invites from the top ten referrers

  1. 1º171
  2. 2º65
  3. 3º40
  4. 4º36
  5. 5º31
  6. 6º27
  7. 7º26
  8. 8º25
  9. 9º22
  10. 10º6

Points become customers.

54 organizations, 48 stores and 111 rewards listed. The interest is there; the bottleneck is the last step.

Partner engagementLast 30 days
Reward views
1,405
People interested
177
Redemptions
57
Redemption completion5.3%

The main product opportunity.

People who return to the most popular partners40–52%

508,420 MC spent in the period. Interface redrawn from the admin panel.

What the numbers ask for.

My product reading of the data. These are hypotheses and next tests, not measured results.

  1. May had volume, later months had quality

    What the data shows

    May brought 222 sign-ups, but only 47% connected Strava and 22% still work out. From June to October, about three in four new sign-ups connected Strava.

    What I would do next

    Measure acquisition by connected sign-ups, not raw sign-ups. Volume without intent doesn’t sustain the base.

  2. Strava is the activation moment

    What the data shows

    71% of people who connected worked out in the last 30 days. Without the connection, the product can’t see the workout.

    What I would do next

    Get the 283 accounts without Strava to connect, with the in-app timer as a fallback.

  3. Referrals rely on a few people

    What the data shows

    277 of 497 invites became sign-ups. Nine people generated 89% of invites.

    What I would do next

    Give structure, goals and rewards to the people already bringing others in: the basis of the ambassador program.

  4. High interest, few redemptions

    What the data shows

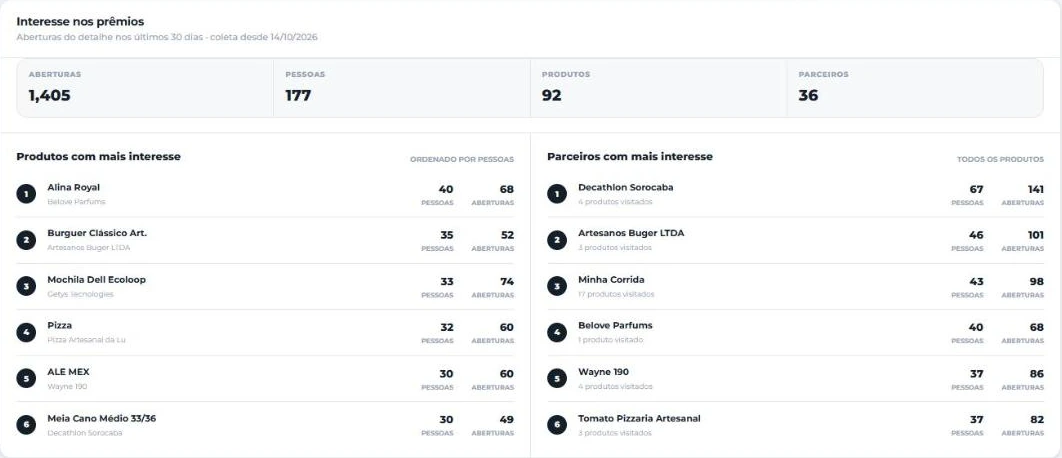
    In 30 days, 177 people opened rewards 1,405 times, but redemption completion was 5.3%.

    What I would do next

    Hypothesis: the gap between balance and MC price. Test: a cheap first reward and a progress bar toward a saved reward.

The product behind the app.

The admin panel gives the team the same clarity the app gives runners: what’s happening and what to do next. Crops from the real panel.

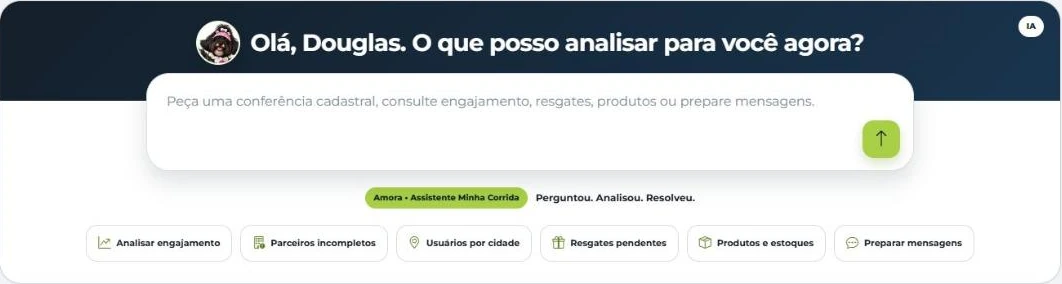
AI assistant: Amora answers questions about engagement, partners and redemptions in plain language.

AI assistant

Amora answers questions about engagement, partners and redemptions in plain language.

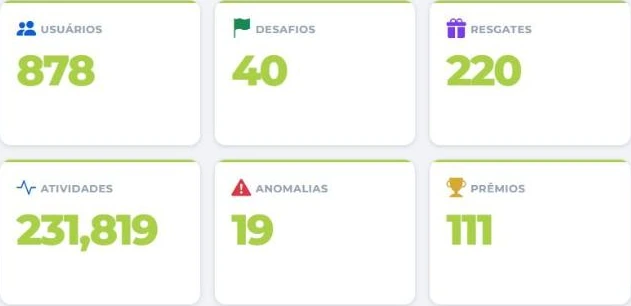
The day in six numbers: Users, challenges, redemptions, activities, anomalies and rewards above the fold.

The day in six numbers

Users, challenges, redemptions, activities, anomalies and rewards above the fold.

Interest in rewards: Which products and partners draw the most people, measured by detail views.

Interest in rewards

Which products and partners draw the most people, measured by detail views.

Catalog coverage: Shows how many challenges each profile and level can see and flags gaps before users notice.

Catalog coverage

Shows how many challenges each profile and level can see and flags gaps before users notice.

A whole year in motion.

The Vida Ativa program brings the app’s mechanics into companies: four big challenges a year, with ongoing engagement in between. I helped build the decks used by the sales team and the founders.

  1. Month 1
  2. Month 2Get movingA 21-day habit.
  3. Month 3
  4. Month 4
  5. Month 5Teams in motionFriendly team competition.
  6. Month 6
  7. Month 7
  8. Month 8Progress at your paceGoals that fit each person.
  9. Month 9
  10. Month 10
  11. Month 11Further togetherA shared goal and celebration.
  12. Month 12

Three revenue streams

  • Runners

    A premium tier for people who want more challenges and perks.

  • Partners

    Local businesses offer rewards and gain returning customers.

  • Companies

    Vida Ativa brings the same mechanics to employee wellbeing.

Launch films.

Motion and editing to explain the product in under a minute and bring in partners and companies.

Consistency can be designed.

Minha Corrida taught me to treat the product as a system: the app, the admin panel, the partners, the films and the sales deck all answer the same question. What brings someone back tomorrow?

Let’s talk

Data source: the Minha Corrida admin panel, reviewed on November 13, 2026 without changing any data. People’s names were removed from the screens. The films come from the project archive.

Next case study 05 / 09

All projects
Brand identity · Education

Boa Bolsa

An identity that helps students find scholarships

Explore case study